TrendLens – New Features and Office Hours Highlights
How’re we doing?
We’re approaching end of summer and the 4th quarter will be here before we know it! So how are we doing as an industry so far? Let’s take a look at a couple of indicators – vehicle miles traveled for the first half of the year are strong – higher than pre-pandemic (2019) and last year:

Vehicle miles traveled (trillions), January through June for years noted. Source: Arity.
Another proxy indicator is retail automotive aftermarket sales. Sales for the first five months of the year have risen year-over-year:

Auto Parts, Accessories & Tire Stores Sales ($M), January through May of years noted. Source: TrendLens
Automotive aftermarket retail sales from January-May 2022 is 11.3% higher than January-May 2021. Someone recently asked if the 8.5% expected sector growth for 2022 is realistic. While this isn’t the whole story, it suggests continued strong growth for the industry. And with the upward VMT trend suggesting that service and repair is also strong, there are good reasons to be optimistic for industry performance this year.
You had me at data …
If you’re reading this column, you are probably into data. We recently held “office hours” to discuss indexed data. If you’re not familiar with the concept, take a few minutes to read this nice article by the Federal Reserve Bank of Dallas.
Readers of this column have heard me talk about industry data in TrendLens, our Auto Care Association data platform available exclusively to members. With continuing uncertainties in the economy, it’s never been easier to baseline a set of aftermarket data points and compare their movement against one another.
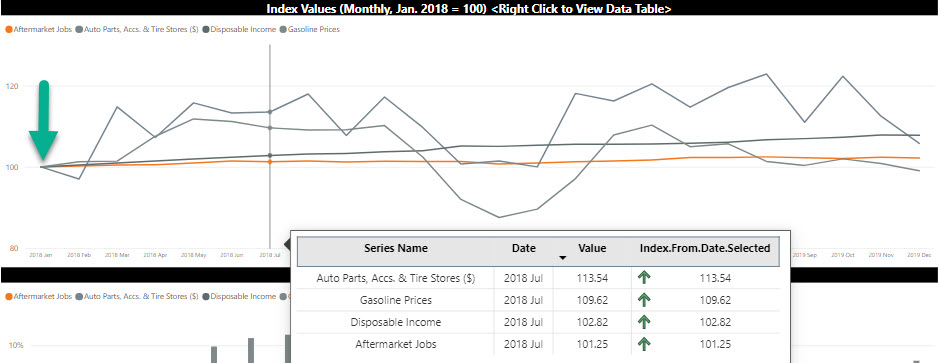
As pictured below, several monthly indicators are indexed to 100 for January 2018 (green arrow) and plotted from January 2018 through December 2019. This allows you to compare the movement of several unrelated variables of different scales and units on one chart. This example has aftermarket retail sales, price of gasoline, disposable income, and aftermarket employment. Since these indicators are reported in millions of dollars, dollars per gallon, billions of dollars, and thousands of jobs, respectively, indexing them makes them unitless and uniform in scale since you’re really looking at percentage deviation from the baseline level.

Selected indicators, January 2018-December 2019. Source: TrendLens
Members can learn more about this tool in TrendLens by watching this Office Hours with Mike session
TrendLens Office hours is a live session with Mike Chung, Director, Market Intelligence to help users explore the data, views and reports available and come with the questions surfacing in their organizations. Join a live office hours session to discuss the data you are looking at in a small group setting.
New data points in TrendLens!
We have introduced several new Economic and Industry Indicators:
• Automotive Maintenance & Repair Employment
• Average Hourly Wages – Automotive Maintenance & Repair
• Consumer Loans – Credit Cards & Revolving Plans
The first two are in addition to our Aftermarket Employment indicator – given the continued challenges related to automotive service technicians, these indicator data will provide employment and wage trends and inform service provider hiring and payroll planning.
The third is included to give a better sense of consumer demand and proclivity to spend. While disposable income is a key predictor of aftermarket demand, Daniel Zenko (director of data innovation at Auto Care) notes that “consumer willingness and ‘room’ to spend” is another important aspect to consider.
Zenko continues: “Adding a consumer loans indicator helps us better understand consumers’ purchasing outlook and their debt servicing burden as a potential modifier. If interest rates and debt burden are low and consumer confidence is high, consumers will spend whatever disposable income they have. And vice versa if those conditions are flipped.”
Given the higher inflation rates, we expect that this data point will be an interesting one to monitor. Members can find these new data points in the menu as pictured below:

New Economic & Industry Indicators available in TrendLens
Keep in touch with any questions about the platform and let me know if there are other data points that you would like to see in TrendLens!

Michael Chung, Director, Market Intelligence
Ready to dive into market research? I provide the industry with timely information on key factors and trends influencing the health of the automotive aftermarket and serving as a critical resource by helping businesses throughout the supply chain to make better business decisions. More About Me

Market Insights with Mike is a series presented by the Auto Care Association's Director of Market Intelligence, Mike Chung, that is dedicated to analyzing market-influencing trends as they happen and their potential effects on your business and the auto care industry.
More posts
Content
-
[WATCH] Driver Behavior Trends and Their Impact on Parts and Service Opportunities
March 17, 2022This webinar analyzes driving behavior at the national, state, and local levels. Gain insights into: consumer behavior; driving patterns; and potential impacts on parts replacement, service and repair scheduling, vehicle age, and the car parc.
-
[WATCH] 2022 Business Outlook: Top Emerging Opportunities and Challenges
February 4, 2022This webinar explores need-to-know emerging opportunities and challenges for the coming year: current status of supply chain issues and what to expect in the year ahead and more.
-
[WATCH] How to Use Vehicle Miles Traveled to Better Your Bottom Line in 2022
December 3, 2021Vehicle Miles Traveled has been respected for years as a key indicator of aftermarket opportunities. Historically, planning has been limited to directional indicators but now aftermarket businesses can leverage more detailed insights on geographic differences as well as vehicle differences to more effectively take advantage of aftermarket opportunities.

