July 8, 2021
Vehicle Miles Traveled - Trends and Drivers
by Michael Chung, Director, Market Intelligence
Vehicle Miles Traveled (VMT) Trends
VMT has climbed since March across the country as the weather warmed, vaccination rates increased (55.1% of all U.S. residents as of July 7 - Source: The Washington Post), and as summer travel began. Users of TrendLensTM have observed that Arity’s* mileage has been noticeably higher than USDOT’s – by up to 15%.
Source: TrendLensTM
Why is this?
USDOT uses continuous and temporary traffic counting stations nationwide to derive miles traveled data, with many counting stations distributed on highways. Of the 660M miles covered daily by Arity via telematics data, more than two-thirds is from driving on arterial roads. Given the more “localized” driving patterns by Americans throughout the pandemic (e.g., far less highway commuting, far more local errands and local trips on residential/commercial thoroughfares but not interstate/U.S. highways), we expect Arity’s data to be accurate, particularly given the changes in driving habits (also including time of day for trips, e.g., less volume during peak rush hour).As the DOT monitoring system is static and reliant on highway traffic to be a good proxy for overall VMT; DOT estimates also rely on a stable mix of highway vs. arterial road traffic. So if there is a disproportionate drop in local traffic, like we had in Spring 2020, DOT data will likely overestimate the true/actual VMT. Likewise, if local traffic disproportionately increases, as it has over the last few months, then we expect that DOT data will underestimate the true/actual VMT.
So what’s driving the difference? How will this fare for the future?
Let’s look at a few things that are affecting driving patterns:
-- People have moved
-- Flexible work arrangements
Net Migration Losses for Urban Areas
The chart below shows the net migration of individuals moving away from (blue) and into (gray) urban areas. The solid lines represent the four quarter moving average – notice the divergence as called out with the gold box.
Source: Federal Reserve Bank of Cleveland, May. 2021
Not only are individuals migrating from urban neighborhoods, they were not moving into urban neighborhoods (for more details, see the initial Feb. 2021 article “Did the COVID-19 Pandemic Cause an Urban Exodus?”).
According to a Bloomberg CityLab analysis, 82% of urban centers experienced a net outflow of residents while 91% of suburban counties saw a net inflow of residents (“More Americans Are Leaving Cities, But Don’t Call It an Urban Exodus”, April 2021). This is also seen in the chart below:

Source: “Coronavirus Moving Study: People Left Big Cities, Temporary Moves Spiked In First 6 Months of COVID-19 Pandemic”, June 2021.
Getting Back to the Office…Mostly
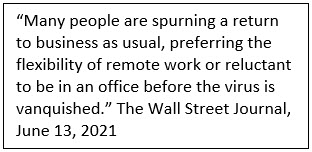
Companies are generally staging for a return to office around Labor Day. Global Workplace Analytics estimates “we will see 25-30% of the workforce working at home on a multiple-days-a-week basis by the end of 2021,” (“Work-At-Home After Covid-19 – Our Forecast”). Based on a survey of 2,500 full-time workers, “69% of U.S. employees worked from home at the peak of the pandemic” (State of the Remote Workforce, Global Workplace Analytics and OwlLabs, 2020, does not include self-employed).Human resources experts expect voluntary turnover to increase as quit rates reached their lowest levels in nine years during the pandemic (“Turnover ‘Tsunami’ Expected Once Pandemic Ends”, Society of Human Resources Management, March 2021). Ability to work remotely is a considerable factor for employees across industries – Ladders CEO Marc Cenedella notes, “Remote is going to be the new signing bonus,” (“Remote Work Is the New Signing Bonus”, The Wall Street Journal, June 26, 2021).

Industry Implications
So what’s this all mean for the aftermarket? While VMT is steadily recovering to pre-pandemic levels, driving patterns have changed for many – commuting fewer days each week, perhaps at different times; driving a different vehicle and for various purposes. Service/repair, and retail companies are taking notice and advising their customers accordingly as they find a “new normal”. Telematics-based data is establishing a “new normal” in VMT statistics that matches macro-level changes in driving patterns across society in real time. Using this data in the context of behavioral changes will allow the aftermarket to respond to rapidly evolving market conditions more accurately.
*Arity is a wholly owned subsidiary of The Allstate Corporation. Mileage is calculated based on data collected from 23 million active connections from multiple third-party anonymized and aggregated sources, including consumer apps, insurance telematics mobile and device programs.

Welcome to the new YANG Effect! Your one-stop quarterly newsletter for all things Automotive Aftermarket contributed to and written by under-40 industry professionals.
More posts

Market Insights with Mike is a series presented by the Auto Care Association's Director of Market Intelligence, Mike Chung, that is dedicated to analyzing market-influencing trends as they happen and their potential effects on your business and the auto care industry.
More posts
Subscribe to updates
